Realised account P&L
The Zerodha page independently confirms the displayed account P&L. It does not prove capital employed, percentage return, drawdown or strategy attribution.
A public operating record for an India equity system: independently displayed realised P&L, complete research notes, daily decisions, and risk limits. The evidence comes before the narrative.
01 / Personal account record
The chart follows open quantity after each broker fill, marks it to each day’s close, and transfers profit from unrealised to realised as positions are sold. It uses the full Zerodha equity account rather than the narrower strategy-only subset.
The curve replays 2,373 broker fills. Realised P&L reconciles to dated Zerodha exports and the final ₹477,570.33 broker total. Remaining FIFO quantity is marked to daily closes; historical unrealised values are reconciled between dated broker snapshots, including the owner-confirmed ₹5.50L peak. The values between those controls are reconstructed daily estimates, rather than archived broker snapshots. Download the plotted ledger →
02 / Evidence hierarchy
Trust comes from preserving the boundary between broker evidence, internal reconstruction and simulation. Each answers a different question.
The Zerodha page independently confirms the displayed account P&L. It does not prove capital employed, percentage return, drawdown or strategy attribution.
The fill replay reconciles to dated Zerodha P&L exports, including the final ₹477,570.33 realised total. Historical daily marks between account snapshots remain reconstructed.
Simulated results are labelled separately and include their capital, cost and rule assumptions. They are evidence about a model, not realised investor returns.
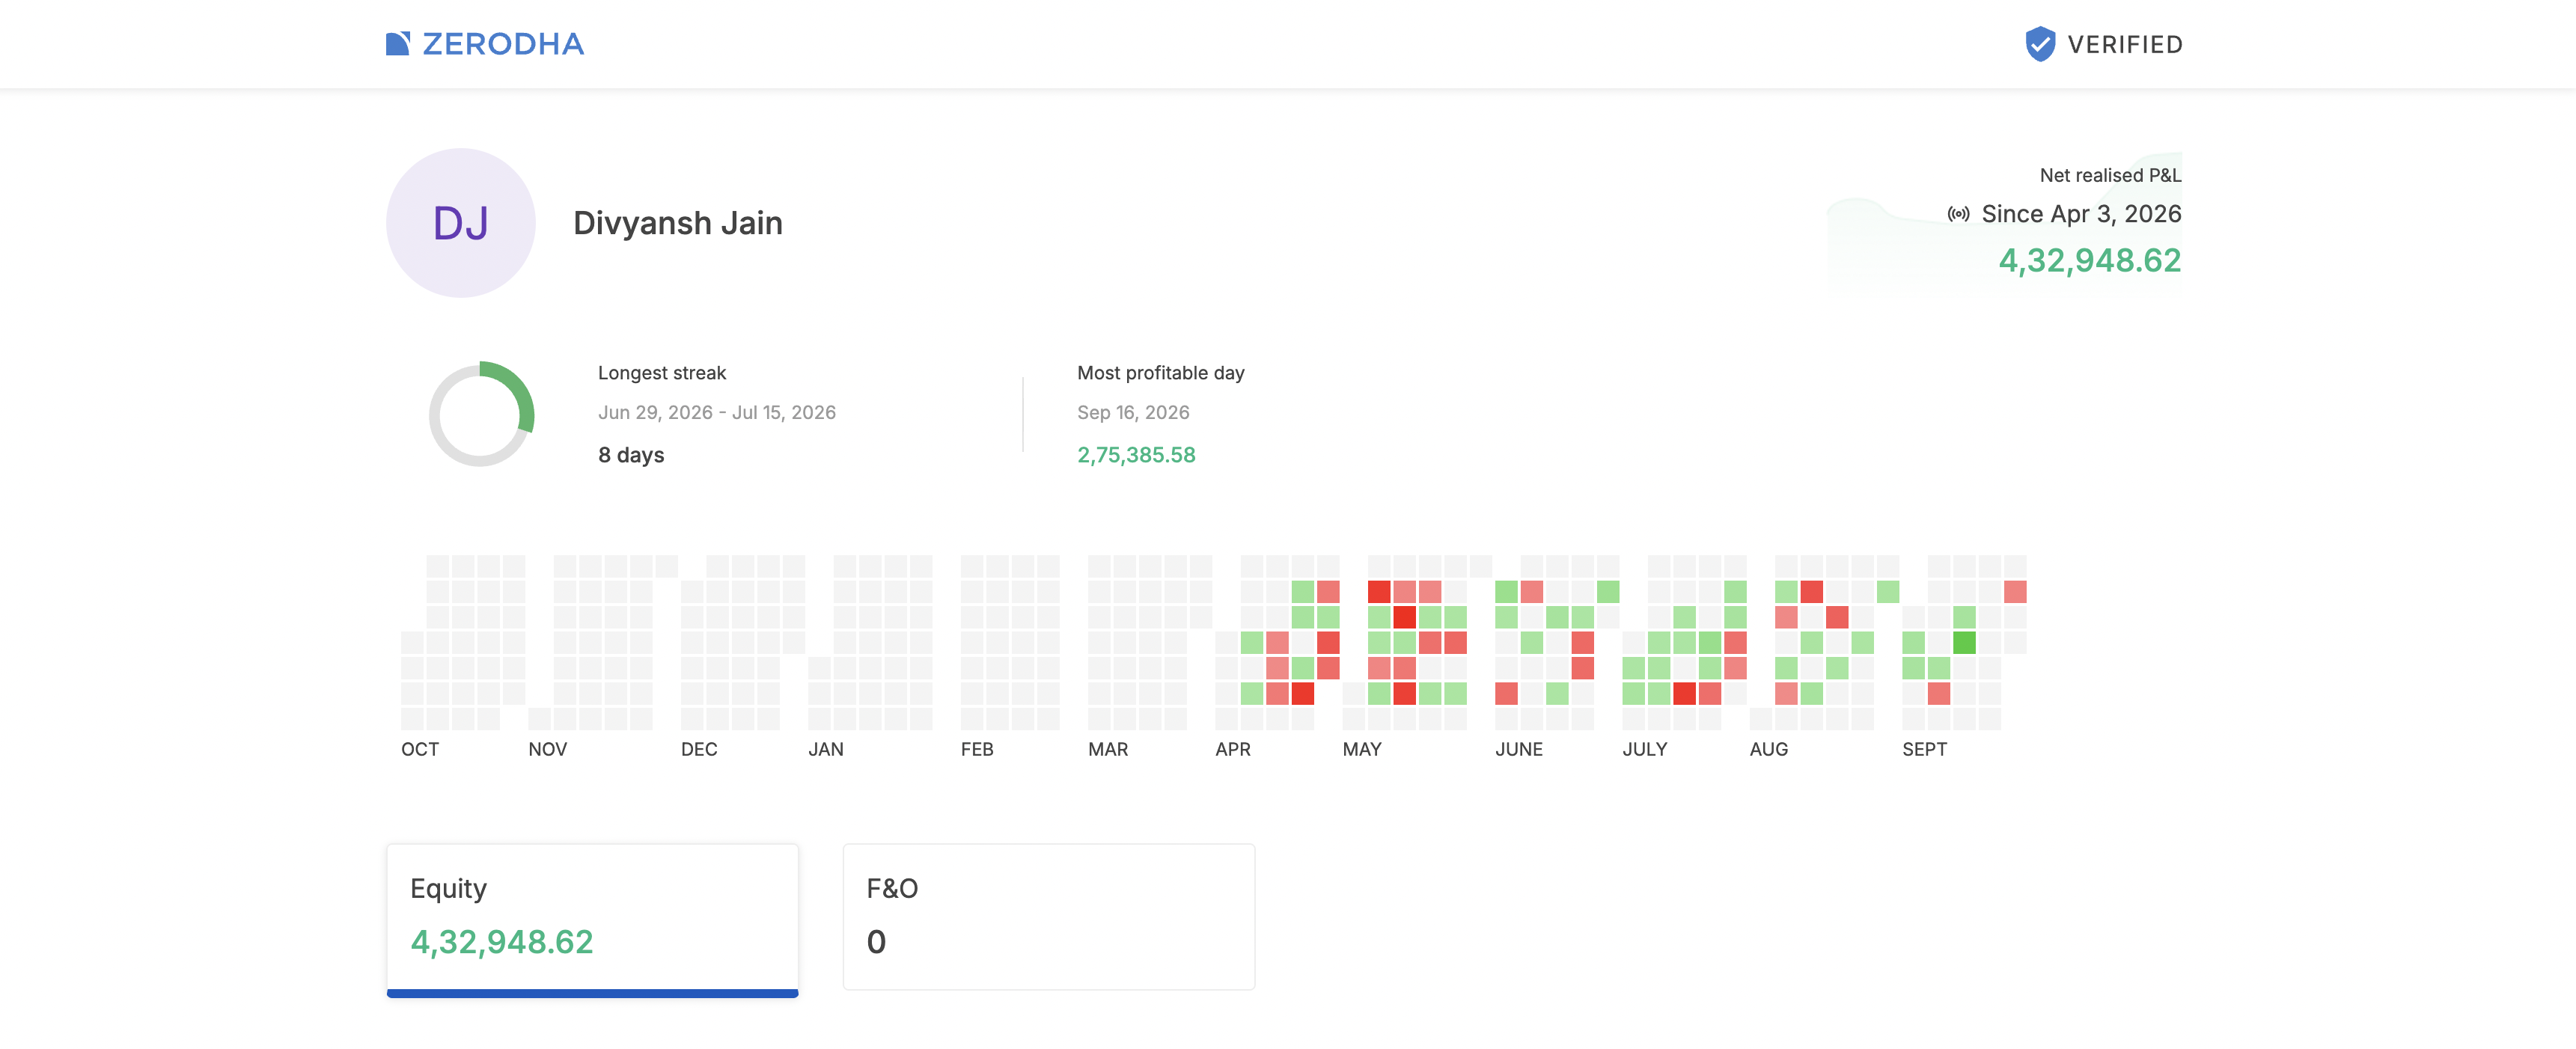
Click the screenshot to open the live public verification on Zerodha.
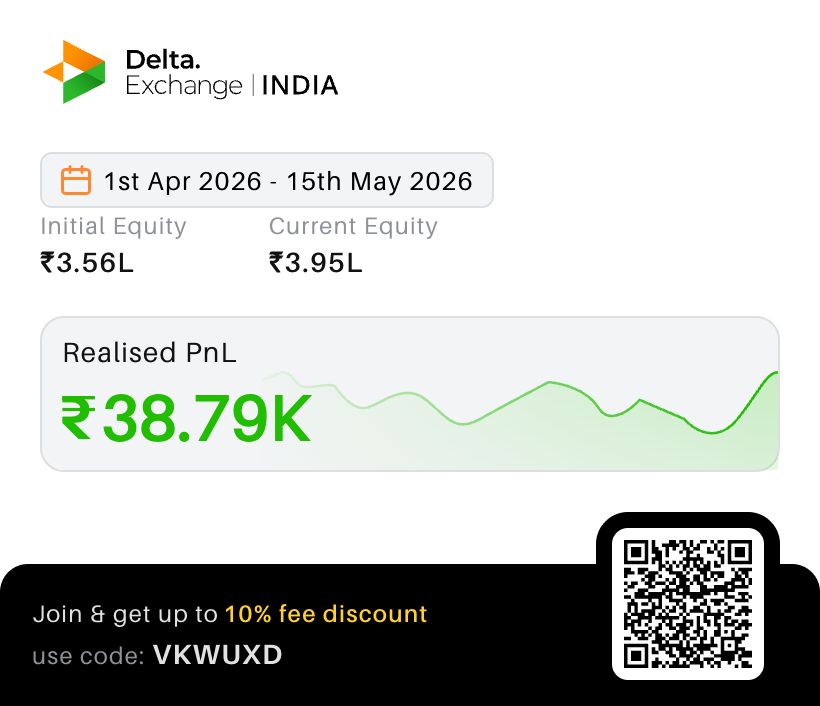
A separate crypto account artifact. It is not included in the equity record above.
03 / Range of outcomes
The chart keeps unrealised and realised profit separate in every tooltip, while the comparison line uses their sum so selling a position cannot manufacture a return jump.
₹7.27L total P&L on the ₹20 lakh base: ₹5.50L unrealised plus ₹1.77L already realised.
₹4.81L total P&L: ₹4.78L realised and ₹3,107 still unrealised.
04 / Research log
Winning narratives are easy to manufacture after the chart moves. These reports preserve the rules, failures and counter-evidence that shaped the live systems.
The realised record, the bad month, and the risk/reward structure behind a low win rate.
Read analysis →Equity · selectionWhich filters removed opportunity, and whether the best rejected trades were recoverable.
Read analysis →Equity · rejected ideaA good story that failed the split-period and permutation checks.
Read analysis →Crypto · productionExact fills, automatic selection, six-month replay, and the narrow live profile.
Read analysis →Crypto · backtestWhat transferred from the equity logic—and what failed when crypto behaved differently.
Read analysis →Crypto · evidenceThe strongest available evidence and the important claims it still cannot support.
Read analysis →05 / Operating books
Daily operational reports live separately from standing research. Each book keeps its own rules, schedules and evidence.
Scans, gates, setups, positions and retrospectives from the equity service.
24 sessions · newest 2026-10-19 · 18 analysesPerpetual futures · separate researchThe automatic TIS lifecycle, daily book, execution record and research. Crypto is not part of the equity proposition.
4 day(s) · newest 2026-10-07 · 3 analyses06 / Diligence conversations
The strategy is open for serious diligence and regulated-distribution conversations. It is not accepting deposits, pooled money or discretionary client mandates directly.
Evaluate the rules, execution stack, account history and capacity assumptions for a compliant investment approach.
Review the record and register interest while the operating and verification structure is developed.
Help establish TWRR, benchmarking, independent attribution, execution controls and realistic capacity.
A request starts a conversation only. Any future investment service would be offered through the applicable registered entity, agreement, disclosures and eligibility process.
The operating principle
The goal is an investable, independently verifiable system. Until the regulated structure and performance presentation exist, this remains a public personal research record.
Open today’s operating book ↗